CVICU Monitor v3.3

Frequently Asked Questions

Answers to the common questions about how to use the CVICU Monitor and LVAD Monitors.

Controller connection example

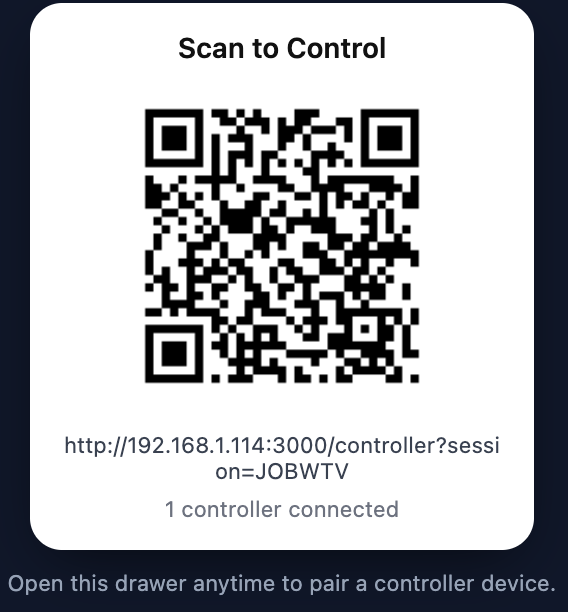
From the home page select “Start New Session.” A session ID and QR appear on the monitor for controllers to join. Scan the QR code or copy and paste the link into another browser window to connect to the monitor.

Ensure that Session ID is the same ID as controller. If it is connected and session ID's of monitor and controller match, but the monitor does not change, refresh monitor and controller screens and ensure each ID match still.

Controller join example

Type in any value into the HR, BP, spO2, RR, CVP, PA, and etCO2 tiles and press the "Send" button. All values will change on the next wave cycle, except HR will change as soon as it is sent.

LVAD parameters view

For the arterial line, CVP, PA, and etCO2 waveforms you can toggle the hide switch on or off. When you toggle it on, your waveform will be hidden as shown in image. When the value is hidden it is still running behind the scenes, so when it is shown by toggling off, whichever value that is showing on the controller will appear. See image for examples.

Clean routes example

At the bottom of the controller, select the ECG rhythm and click "Set Rhythm." On the next cycle, the rhythm changes to the one you selected.

Note: 2nd degree Type II Blocks, Idioventricular, and 3rd degree Block have preset hemodynamic values. If you change those rhythms, adjust vitals and send those values as needed.

V-fib and Asystole have no pulse preset; vitals will not change with those rhythms. These rythms have a pulseless attribute, so etco2 can be utilized to show a value with the "show in no pulse" selected. See etCO2 question for more clarification.

EtCO2 example

Toggle switch on or off to hide/show etco2 waveform.

If the rythm is in v-fib, asystole, or in the lose pulse mode, the etco2 will show 0, unless "show in no pulse" is selected. If it is selected, then the value will show a number, despite the waveform being flat.

You can show etco2 >10 for good compressions, or around 40 for early signs of ROSC using this method.

Scenarios example

Click into each scenario to see what that button does when pressed.

When pressed, whatever device that is operating the controller will emit an emergency like alarm. Ensure your devices volume is on and loud enough.
When pressed, whatever device that is operating the controller will emit a mild alarm that prompts learner to look at vitals outside parameter. Ensure your devices volume is on and loud enough.
Each time button is pressed, systolic BP and diastolic BP drop by 20 each and CVP drops in half of current value.
Each time this button is pressed HR will increase by 10, systolic will drop by 7 and diastolic will decrease by 6 and CVP will increase by 4. Can adjust values by sending BP parameters as well.
Each time the button is pressed systolic and diastolic BP will drop by 7 each. HR will increase by 5.
Each time this button is pressed, all values will be lost except for the ryhthm and rate on monitor. Whatever vitals that were present before the lose pulse button was pressed will be cached. When the lose pulse button is pressed again, the cached vitals will return to the monitor.
When this button is pressed, systolic and diastolic BP's will create a pulse pressure of 10. BP waveform will be dampened to reflect low pulsatility and will keep whichever MAP previously shown. e.g. if BP is 112/66 MAP 81, when lose pulsatility is pressed it will keep the MAP 81 but make BP 88/78. When pressed again, BP pulse pressure and waveform will return to previous cached values. e.g. If BP was 88/78 MAP 81, when pressed again it will return to 112/66.
Each time the button is pressed HR will increase by 10, systolic BP will decrease by 10, and diastolic BP will increase by 6. CVP will increase by 4. PA systolic will increase by 4 and PA diastolic will increase by 4. Each button press will make pulse pressure more narrow and CVP/PA, and HR values higher
Press this button to return vitals and waveforms to all initial values. HR 70, BP 112/66, RR 16, spO2 98%, CVP 8, PA 25/13, etCO2 28.
LVAD controller overview

Information related to the LVAD Monitor and LVAD Controller.

Scan QR code or use URL in another browser window to connect LVAD Monitor to Controller. Ensure session ID's match on Monitor and Controller and that "# of devices is connected" is shown.
On the LVAD Controller touch "-" to decrease RPM by 50, touch "+" to increase RPM by 50. Values will change instantaneously on the LVAD Monitor if controller is connected. Touch the green button on controller to switch to a red alert and again to return to green alert.
On the LVAD Controller touch "-" to decrease flow by 0.1, touch the "+" to increase flow by 0.1. If flow goes under 2.5, low flow will display on LVAD Monitor. Values will change instantaneously on the LVAD Monitor if controller is connected. Touch the green button on controller to switch to a red alert and again to return to green alert.
On the LVAD Controller touch "-" to decrease power by 0.2, touch the "+" to increase power by 0.2. If power goes over 10.0W, high power will display on LVAD Monitor and alert will stay red. If power goes under 10,0W high power alert will clear and alert will return to green. Values will change instantaneously on the LVAD Monitor if controller is connected.
On the LVAD Controller touch the "-" to decrease PI by 0.2, touch the "+" to increase PI by 0.2. Values will change instantaneously on the LVAD Monitor if controller is connected. Touch the green button on controller to switch to a red alert and again to return to green alert.